Understanding Browser Layout and Paint
I was curious about layout and paint in the browser's rendering engine, so I researched it. This article summarizes what I found. The rendering engine I will focus on is Chrome's Blink.
Processing Steps of the Rendering Engine
The following articles are useful references for understanding the processing steps of the rendering engine.
- https://web.dev/rendering-performance/
- https://blog.leap-in.com/lets-learn-how-to-browser-works/
- https://silver-birder.github.io/blog/contents/learning_browser_engine/
- https://developer.chrome.com/blog/inside-browser-part3/

- (Not written in the diagram) Parse
- Parse HTML and CSS
- Generate DOM Tree and Style Rules
- JavaScript
- Process visual operations
- Style
- Determine which CSS rules are assigned to HTML elements
- Generate Render Tree by linking DOM Tree and Style Rules
- Layout
- Determine the position and size of HTML elements
- Generate Layout Tree
- Also called Reflow
- Paint
- Paint the pixels to be displayed in the browser
- Divide into layers
- Also called Draw
- Composite
- Overlay layers in the correct order
- Switch from the main thread to the composite thread and raster thread
- The composite thread divides the page into tiles and sends them to the raster thread
- The raster thread rasterizes and stores them in the GPU
Let's take a look at this process in action.
Viewing the Rendering Process in DevTools
Let's open the following simple HTML in Chrome.
<div>Hello</div>
Open DevTools on the page you opened and click the Performance tab. Press the reload button in the upper left to measure.

After measuring, let's take a look at Main.

You should now see the rendering engine process (matching colors) that we just explained.
- Blue
Parse HTML - Purple
Recalculate Style - Purple
Layout - (Yellow is related to JavaScript)
- (Green is related to Paint/Composite)
While it's visually easy to understand, it's difficult to cover everything.
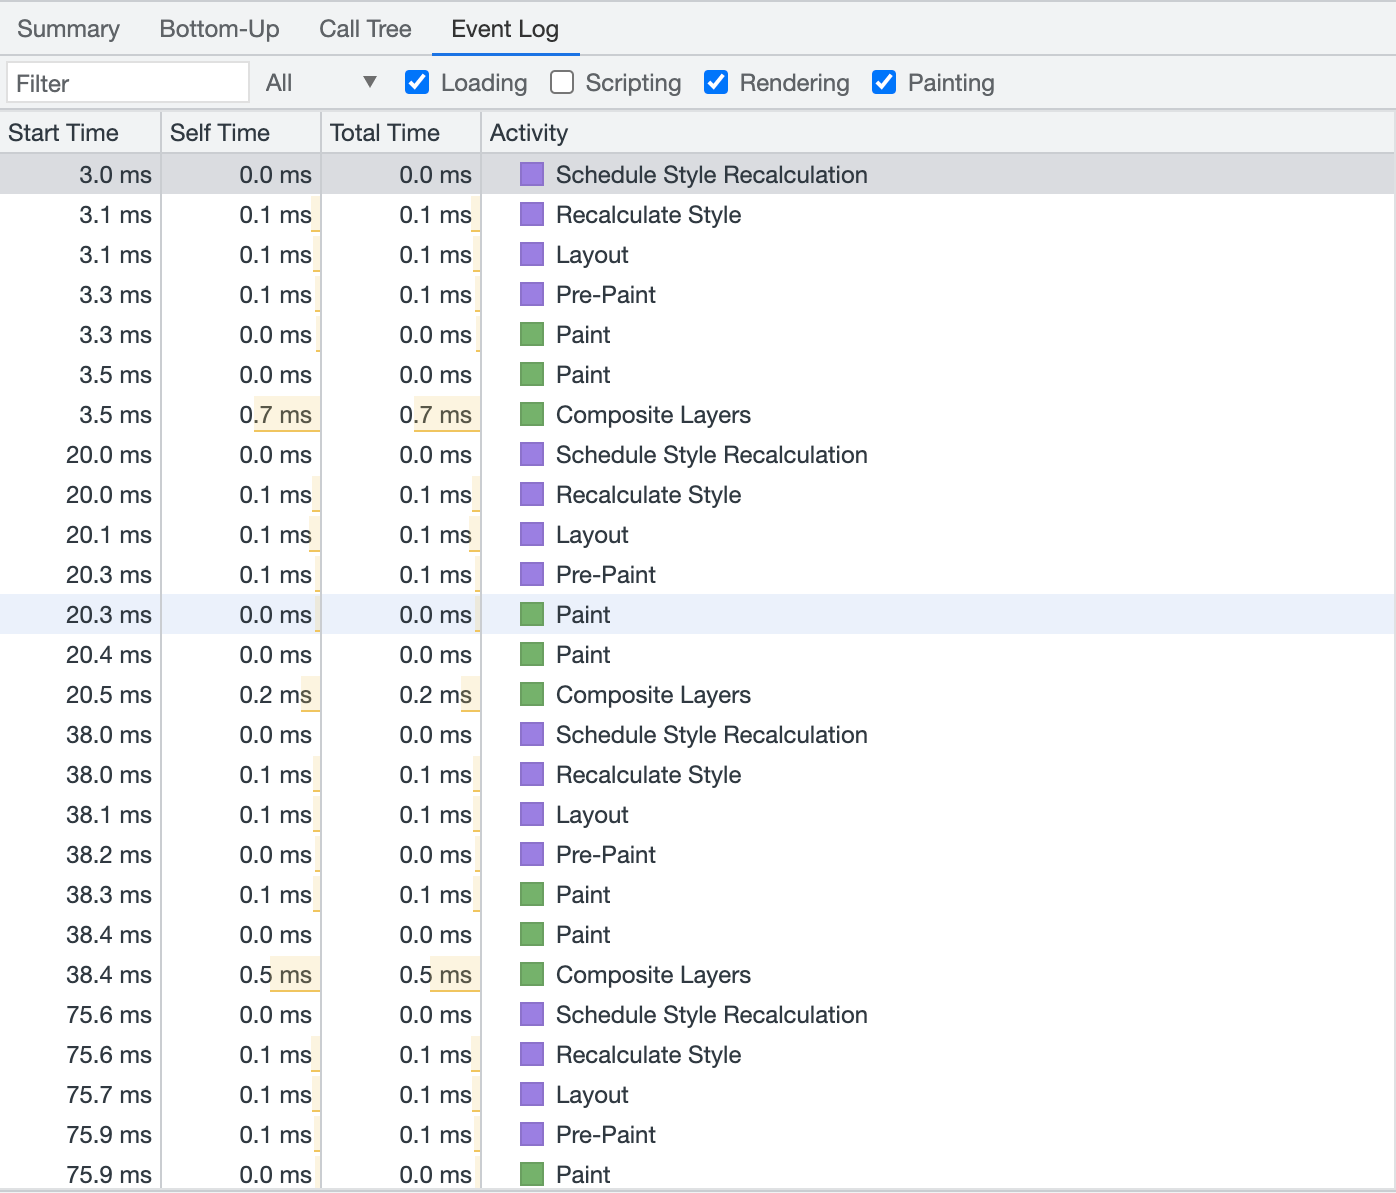
So, we open the Event Log.

The rendering engine's event log is displayed with colors. Here, you can also see the yellow and green ones that we couldn't see earlier.
Tips: Get familiar with the Performance tab
The Performance tab contains various information.
If you start measuring Performance against something that has been released to production all at once, you won't know what to look at.
First, look at the minimum set of HTML, and the amount of information will be narrowed down, making it easier to read.
Also, the color of the process is used at each measurement point. It's easier to read if you also look at the colors.
Browser, Refresh Rate, and 60fps
When creating movement such as animation in a browser, it's good to aim for 60fps.
I quote from the site http://jankfree.org/.
Modern browsers try to refresh the content on screen in sync with a device's refresh rate. For most devices today, the screen will refresh 60 times a second, or 60Hz. If there is some motion on screen (such as scrolling, transitions, or animations) a browser should create 60 frames per second to match the refresh rate.
Browsers update content in sync with the refresh rate. Recent devices seem to be able to update 60 times per second. Therefore, it says that browsers should operate at 60fps.
You can check the fps from DevTools.
Check Frame Rendering Stats in the Rendering tab.
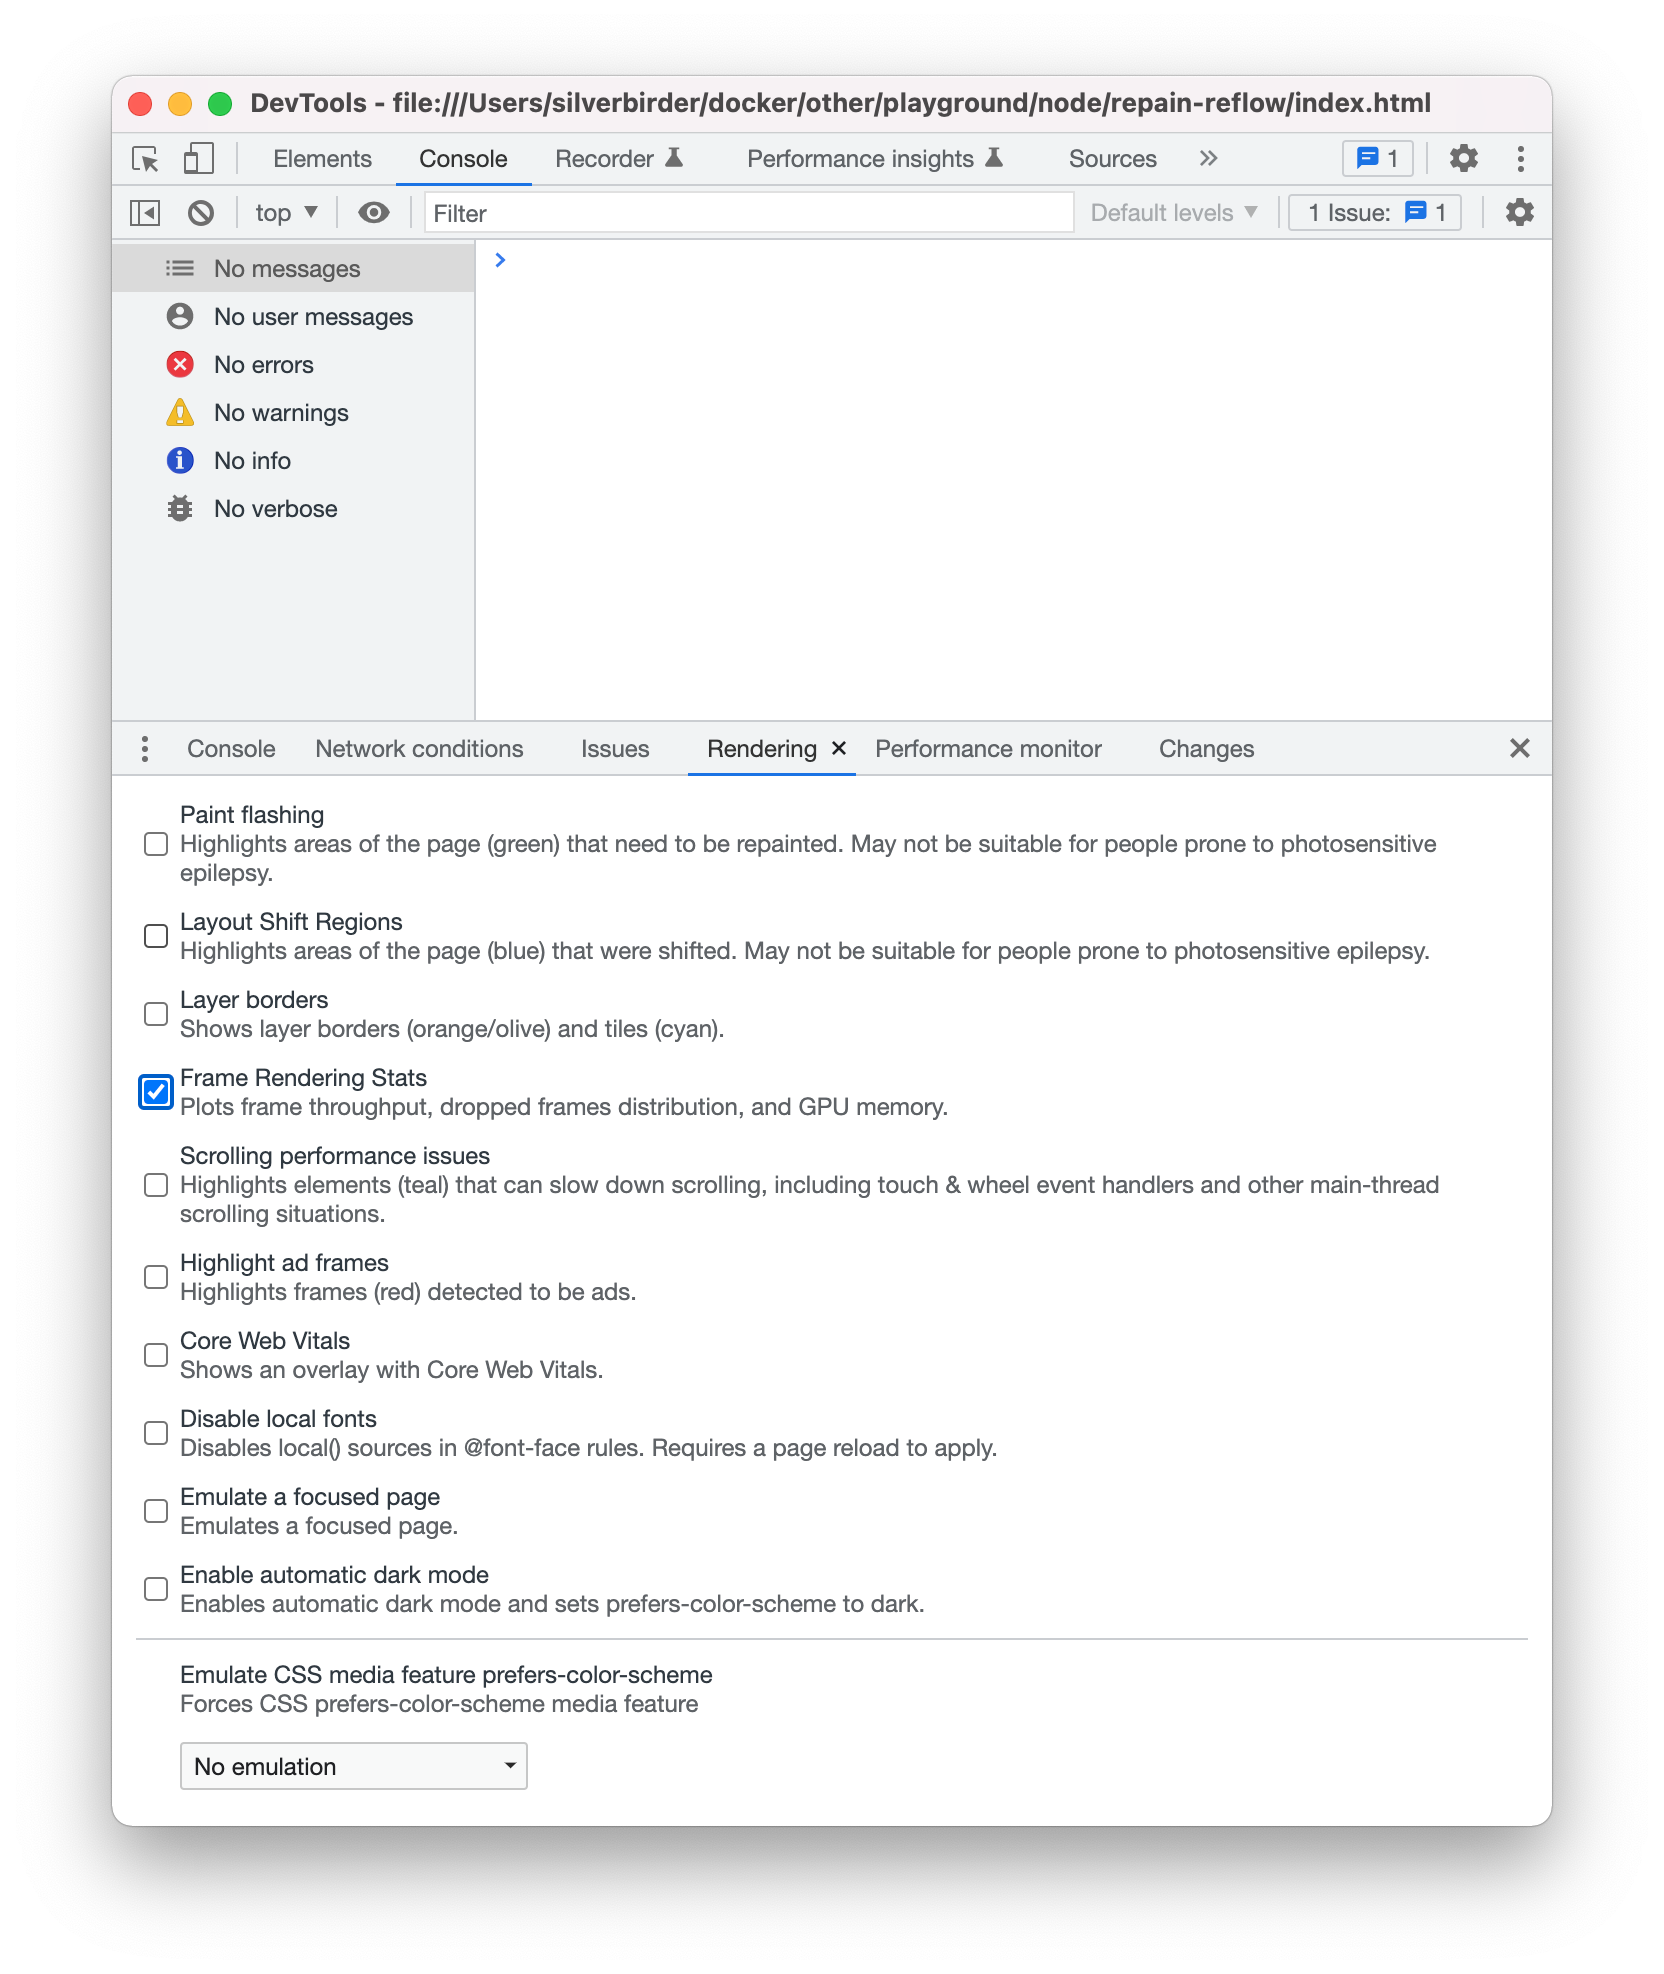
Then, the following image will be displayed on the screen.

Now, the browser seems to be at 18.6 fps.
What happens if the fps is low? A phenomenon called jank occurs.
Jank is any stuttering, juddering or just plain halting that users see when a site or app isn't keeping up with the refresh rate. Jank is the result of frames taking too long for a browser to make, and it negatively impacts your users and how they experience your site or app.
If the refresh rate is not keeping up with the screen, it will result in a non-smooth operation called jank. This can lead to a poor user experience.
You can experience this jank at https://googlechrome.github.io/devtools-samples/jank/.
Layout Thrashing
When writing JavaScript or CSS, adding DOM may trigger layout, or changing color may trigger paint. The rendering engine operates on a single thread, so when it is executing layout or paint, other processes do not operate.
Using the JavaScript functions on the following site requires calculating the layout information at that time, forcing a recalculation of the layout. This is called layout thrashing. Layout thrashing can lead to a drop in FPS.
- https://gist.github.com/paulirish/5d52fb081b3570c81e3a
- For example, clientWidth
Let's show an example. This is a code that changes the style of a button element and refers to clientWidth.
<button>click</button>
<script>
  const b = document.querySelector("button");
  b.addEventListener("click", () => {
    b.setAttribute("style", `width: 100px;`);
    b.clientWidth;
  });
</script>
Executing clientWidth requires the layout information at that time, so the layout is forcibly executed.
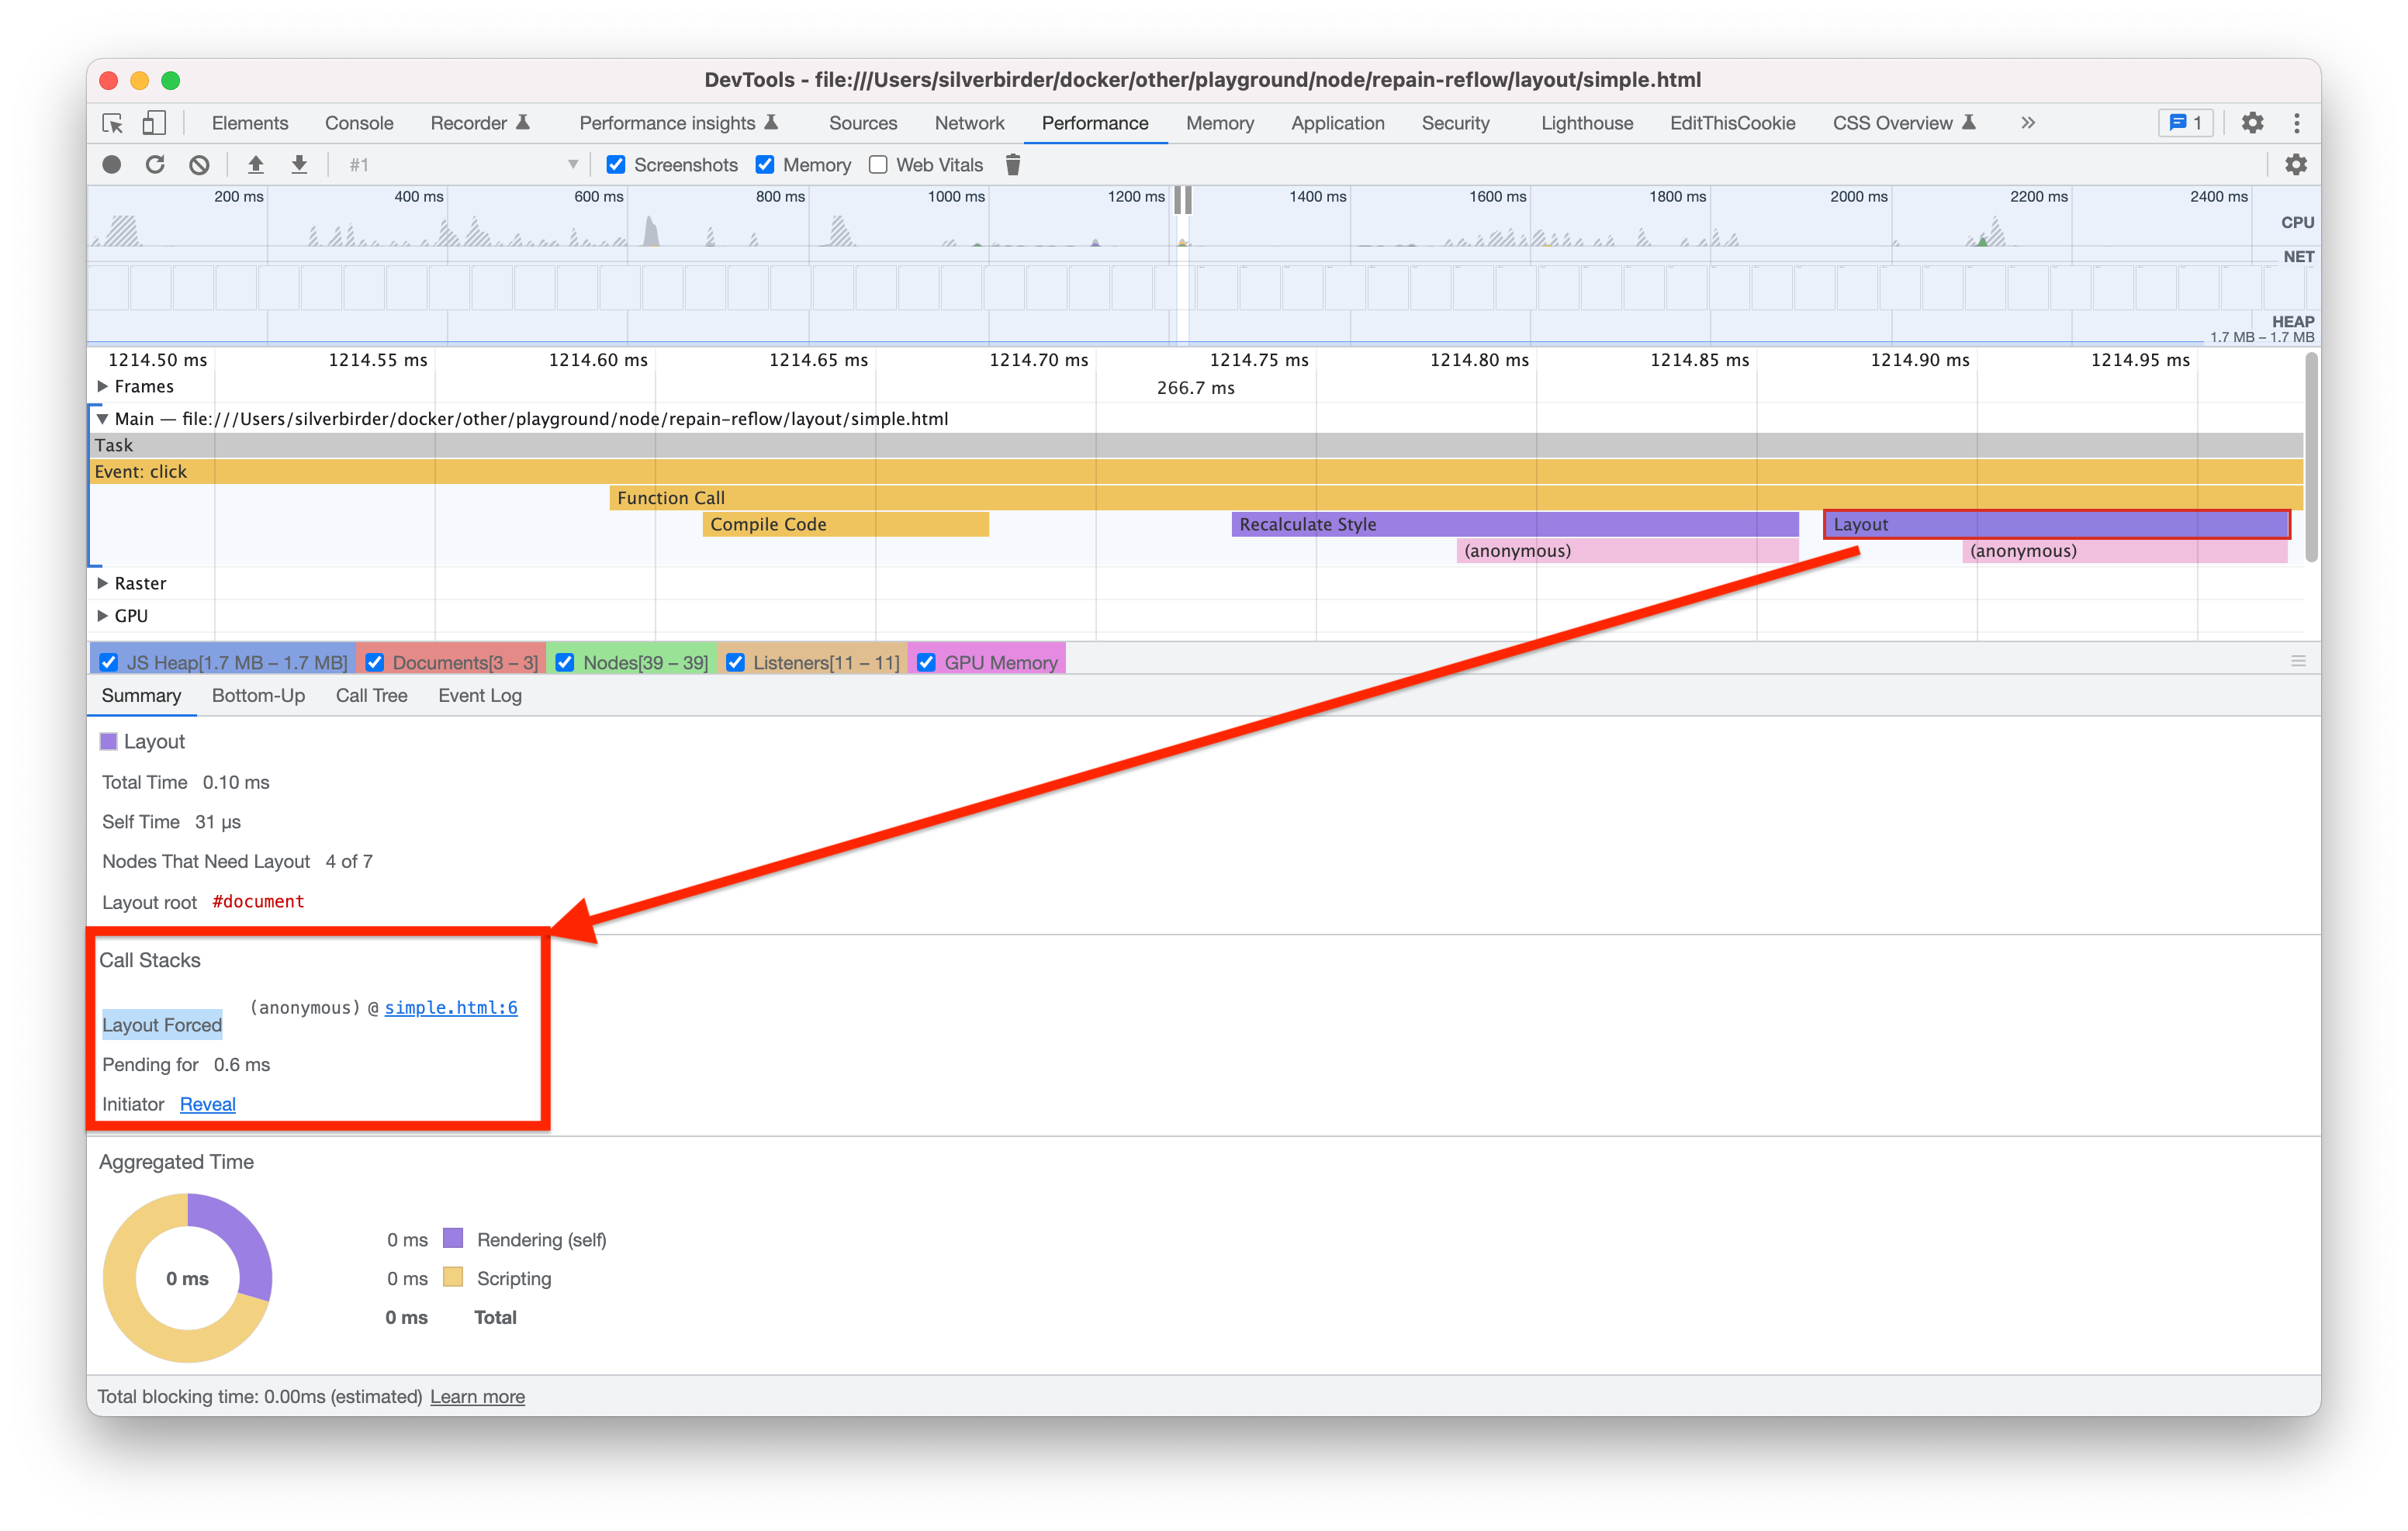
You can see that a forced layout is occurring.
If you comment out b.clientWidth, no Layout Forced will occur. I have prepared a more obvious warning sample.
<button id="btn">click</button>
<div id="root"></div>
<template id="template">
  <div style="position: relative">hello</div>
</template>

<script>
  const root = document.getElementById("root");
  const template = document.getElementById("template");
  [...Array(100)].forEach(() =>
    root.appendChild(template.content.cloneNode(true))
  );

  document.getElementById("btn").addEventListener("click", () => {
    setInterval(() => {
      document.querySelectorAll("div").forEach((el) => {
        el.style.left =
          (Math.sin(el.offsetTop + Date.now() / 1000) + 1) * 500 + "px";
      });
    }, 100);
  });
</script>
From the Performance tab of DevTools, you can see a warning that forced reflow is likely a bottleneck.

The following are possible countermeasures:
- Do not execute functions that cause layout thrashing, or cache them
- Use
Window.requestAnimationFrame()
For reference
There is also a DEMO on the following page.
Paint and Composite
Paint also costs. Therefore, by leaving it to Composite, the main thread is released and performance improves. Specifically, there are things like transform and opacity that operate with composite.
Let's give a specific example. The following example is a sample that moves a square box left and right. We will try the pattern of CSS's left and the pattern of transform as a means of moving left and right.
<style>
  @keyframes return {
    50% {
      left: 200px;
    }
    100% {
      left: 0px;
    }
    /* 50% {
      transform: translateX(200px);
    }
    100% {
      transform: translateX(0px);
    } */
  }

  .box {
    position: relative;
    width: 100px;
    height: 100px;
    left: 0px;
    border: 1px solid black;
  }
  .trans {
    animation-name: return;
    animation-duration: 2s;
    animation-iteration-count: infinite;
    animation-timing-function: ease;
  }
</style>
<div class="box trans"></div>
In the case of transform, comment out the left part and uncomment the transform part.
Open this file in a browser, measure it with the Performance tab, and check the Event Log.
In the case of left, layout, paint, and composite are occurring.
In the case of transform, only composite is occurring.

Thus, choosing CSS properties that only work with composite will make it lightweight. The following site shows which CSS properties update layout, paint, and composite.
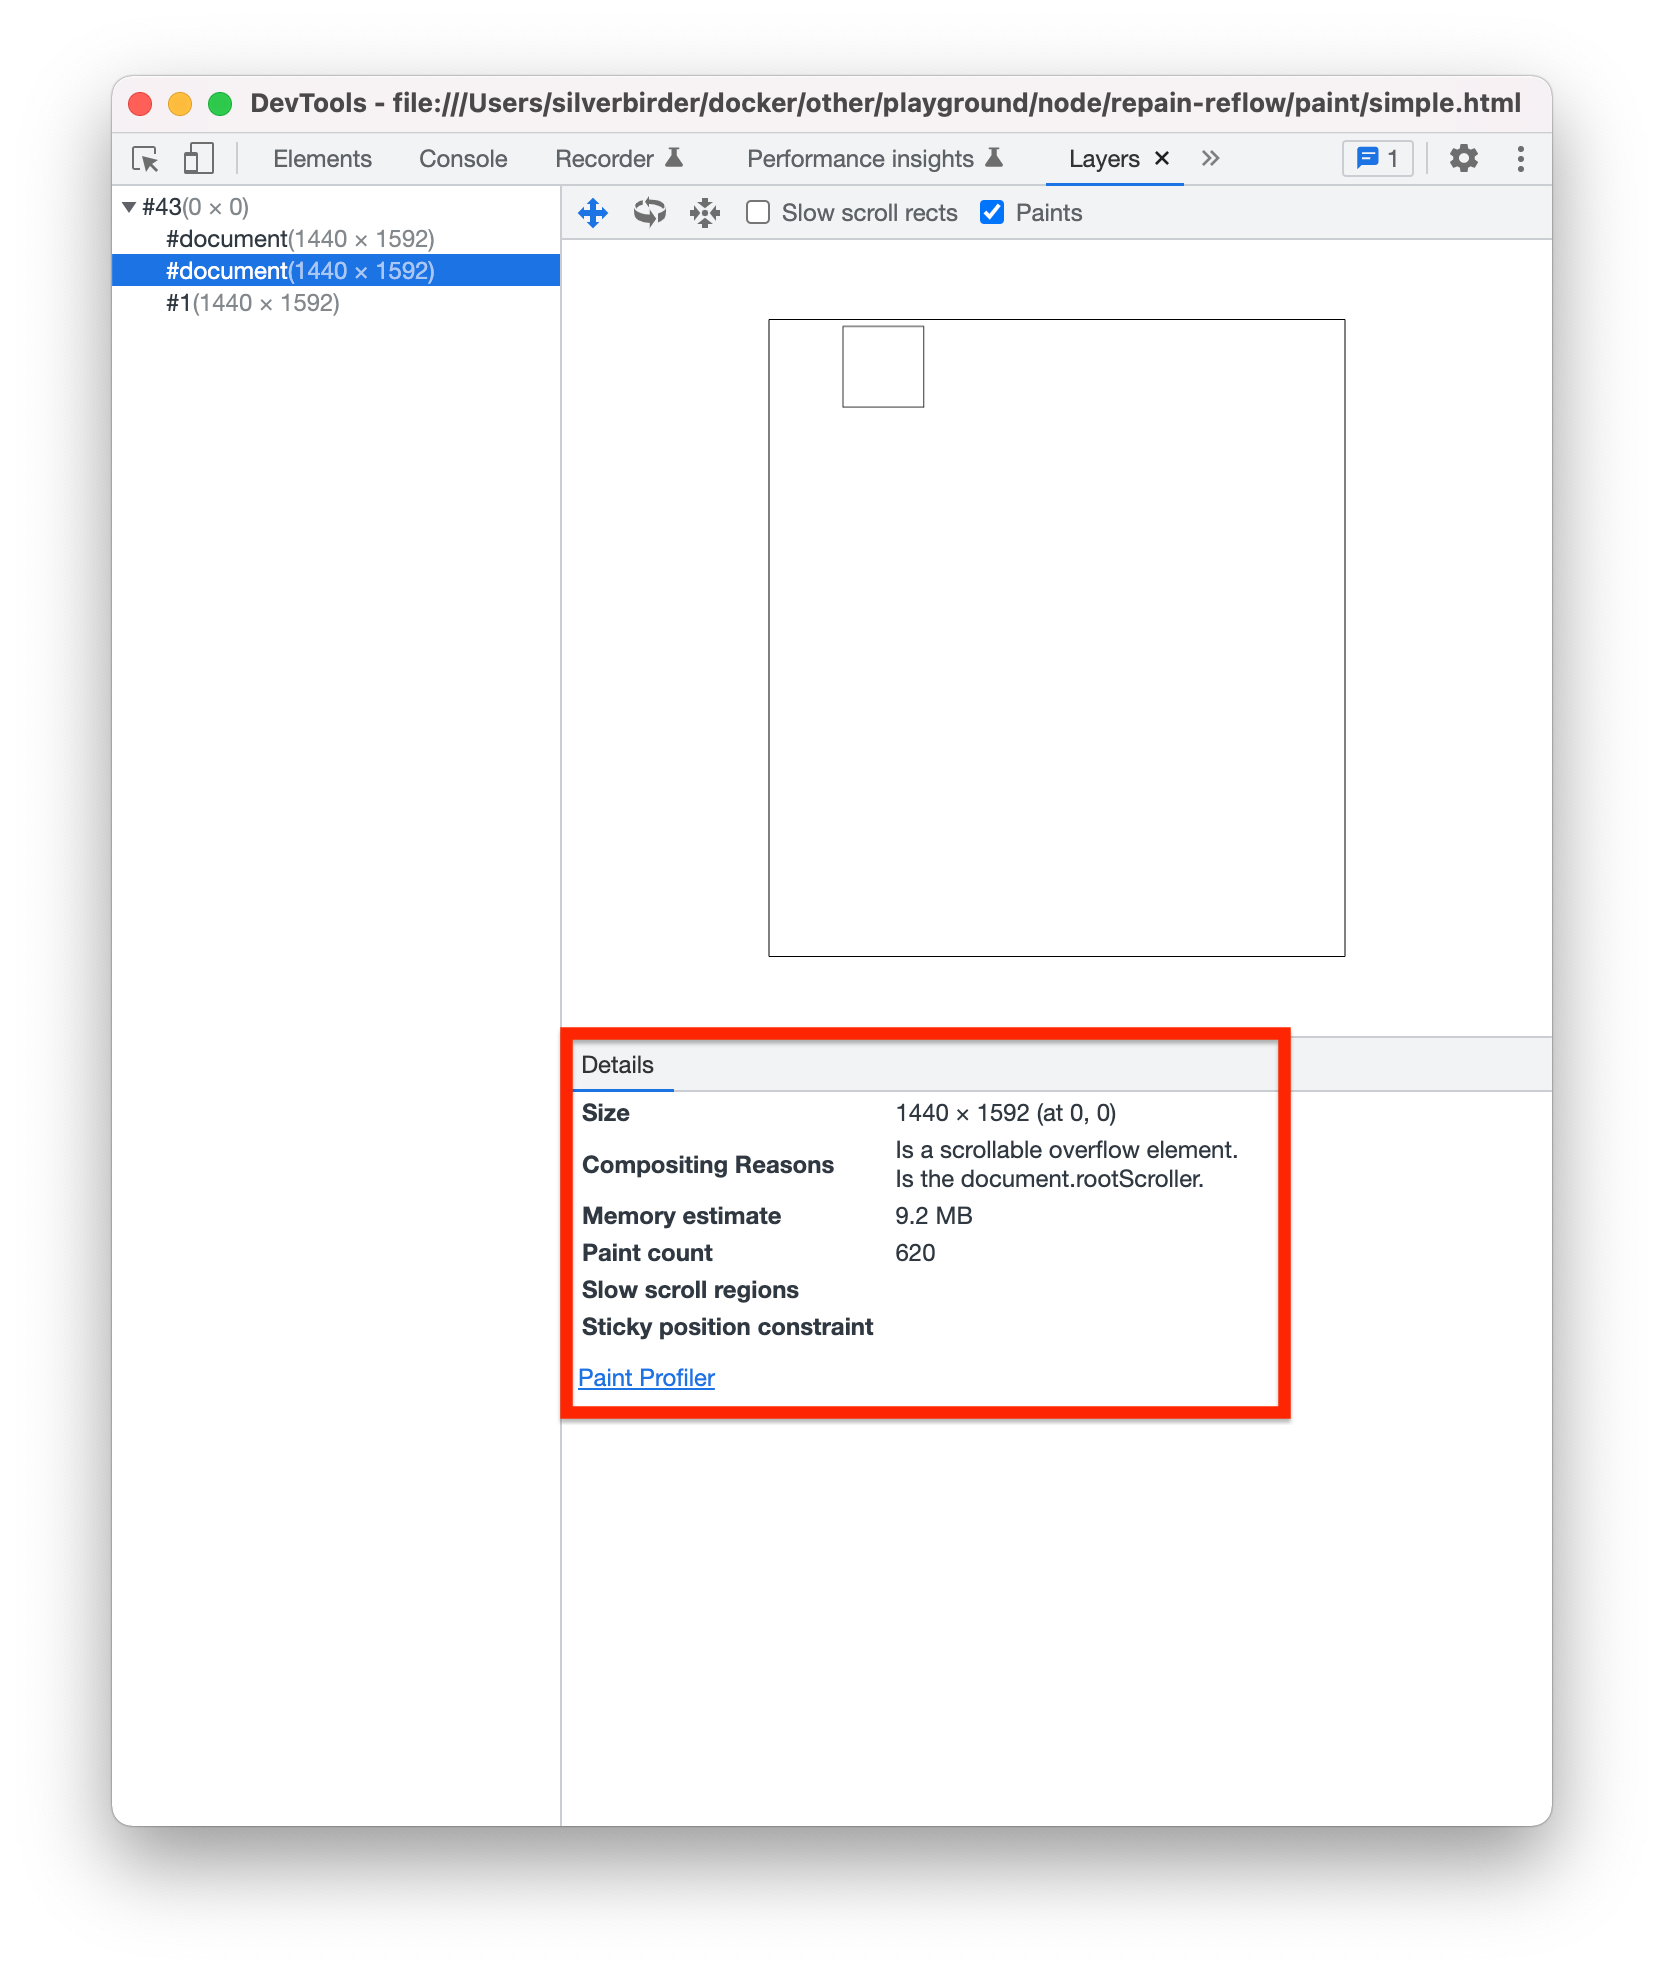
Also, if you open the Layers tab in DevTools, you can see the paint count and layout.
The Layers for left are shown in the following image.
Just a few seconds later, the paint count exceeded several hundred.
The Layers for transform are shown in the following image.
The paint count remained at only 2 times.

In conclusion
While researching layout and paint, there may be people who have unintentionally executed layout and paint. Performance should be tuned when necessary, but I think it's beneficial to know the information in this article as basic knowledge.
References

If it was helpful, support me with a ☕!