Debugging with JavaScript's debugger (Browser/Node.js/Jest)
Let's debug using the standard JavaScript feature debugger.
Since it's a standard feature, it can be used in libraries like React.
Browser
Open the following HTML file in Chrome.
<button>Button</button>
<script>
  document.querySelector("button").addEventListener("click", () => {
    debugger;
    alert("Hello World");
  });
</script>
With the page open, also open DevTools. In this state, click the Button.
Then, it will look like the following image.

At the point where debugger is written, the process is stopped.
From that breakpoint, you can perform operations such as step in, step out, and step over.
In the Console tab, you can check the execution results of variables, functions, etc.
In this way, you can easily debug.
Node.js
In Node.js, you can use debugger in the same way.
Prepare the following JavaScript code.
// main.js
debugger;
console.log("Hello World");
Run this file with the following command.
node --inspect-brk main.js
When you run it, the output will look like the following image.

Then, please access chrome://inspect from Chrome.
When you access it, the screen will look like the following image.

When you click Open dedicated DevTools for Node, it will look like the following image.

Yes, just like before, the process is stopped at the point where debugger is written.
It's simple, isn't it?
Jest
The test framework Jest can also use debugger in the same way.
Prepare the following test code.
// main.test.js
test("1 equal 1", () => {
  debugger;
  expect(1).toBe(1);
});
For this file, execute the following command.
# mac
node --inspect-brk node_modules/.bin/jest --runInBand main.test.js
# windows
node --inspect-brk ./node_modules/jest/bin/jest.js --runInBand main.test.js
When executed, the output will be as shown in the following image.

Also, if you access chrome://inspect from Chrome, you can debug in the same way.

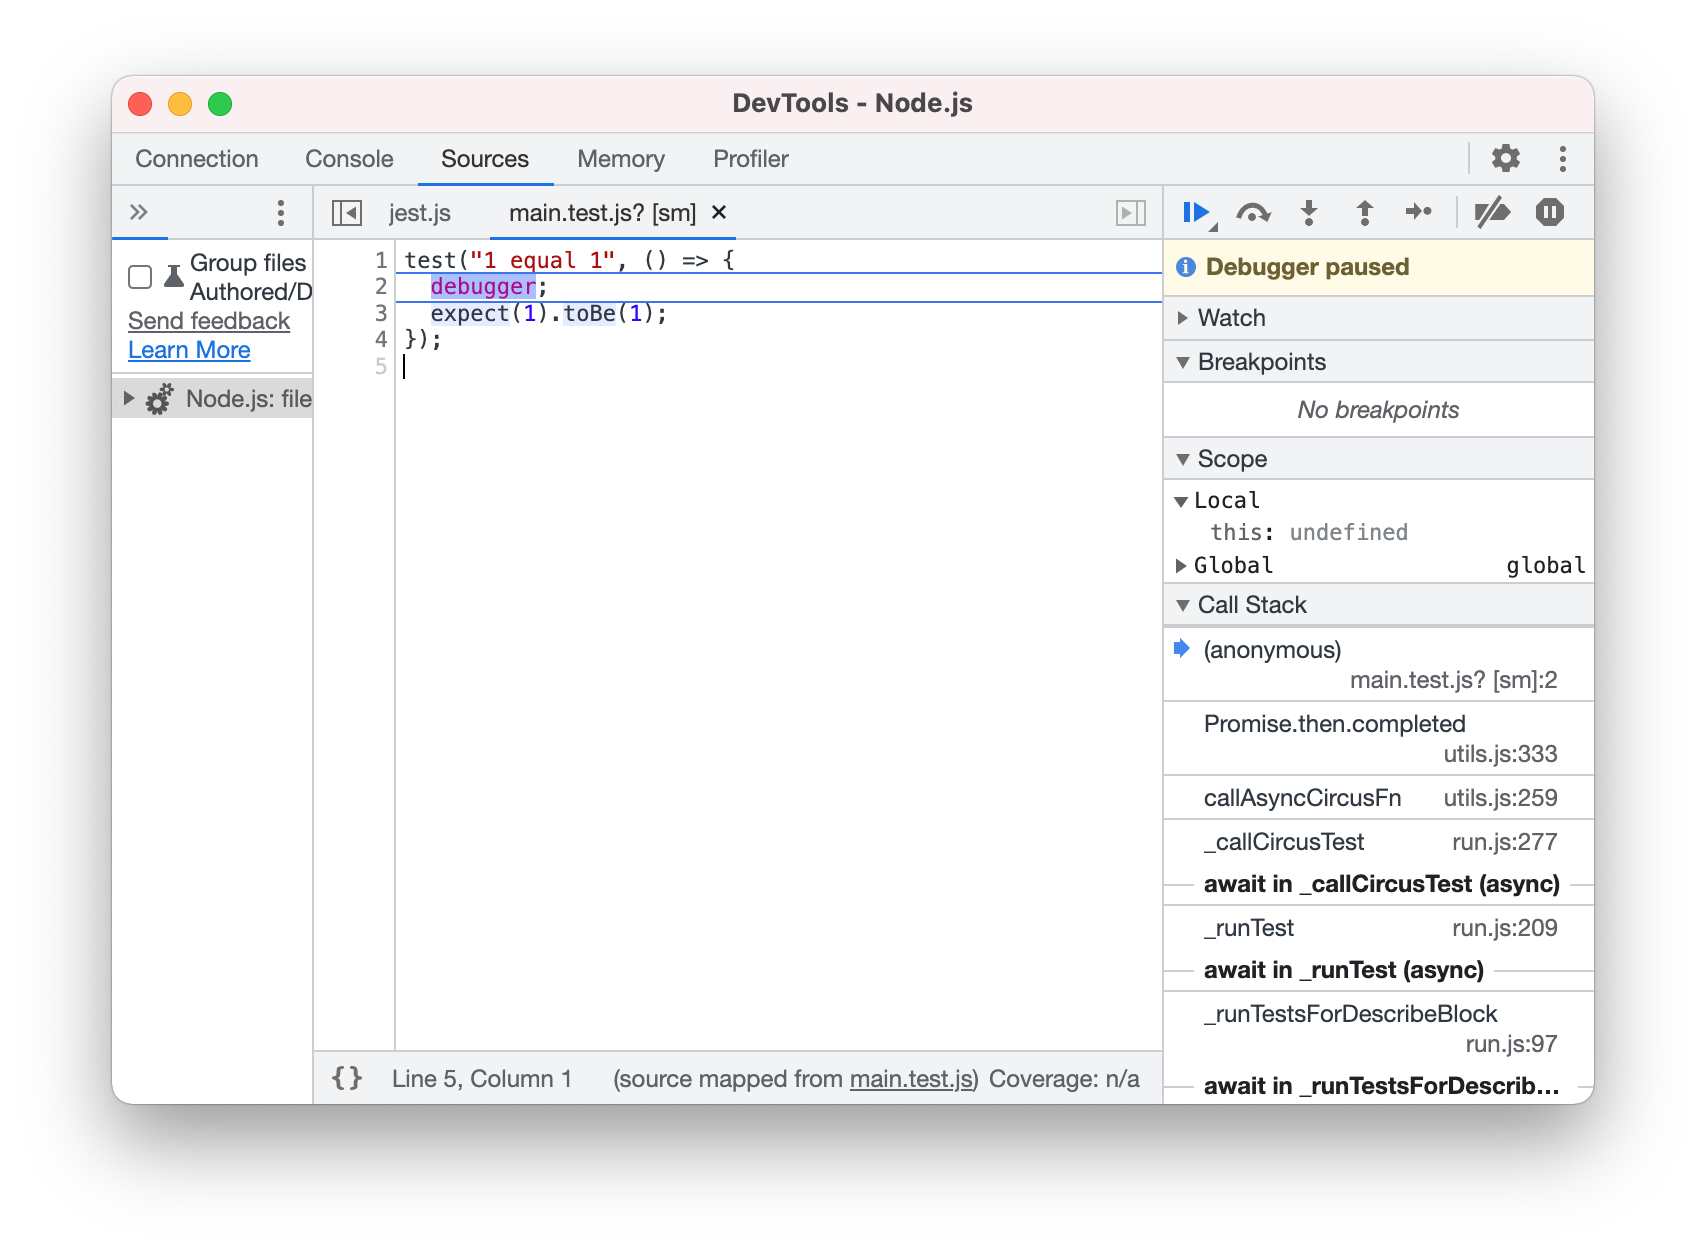
It works the same way as Browser, Node.js. It's easy to understand, isn't it?
In conclusion
You can set up debugging in your IDE or editor, but this way is much easier.
References

If it was helpful, support me with a ☕!